 This article deals with how elaborate graphs can be drawn in C# with the help of the ILNumerics class libraries – if requested the graphs can even be animated as well.
Similar to all of my articles on this blog, I will briefly introduce the library first, then I will obtain the necessary bases which are needed for the coding later on and finally I will show you step by step how to get there. Let’s start!
What is ILNumerics?
ILNumerics is a .NET class library that includes a number of components. The two core components are the Compute Engine and the Visualization Engine. ILNumerics expands the .NET-Framework by complex numbers, scalars and vector calculations, matrices and matrix operations, multi-dimensional data structures and much more.
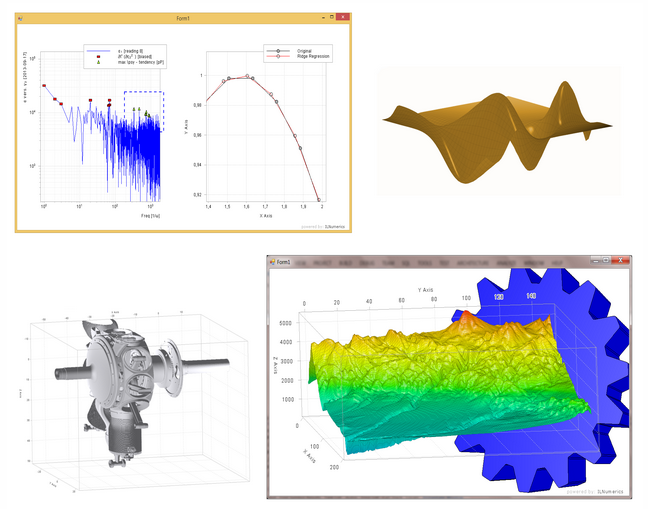
Another advantage of ILNumerics is the Visualization Engine that makes plotting of two or three-dimensional graphs possible. This will be the focus of this article.
What does ILNumerics cost?
If you have dealt with ILNumerics before, you might think that ILNumerics is completely free. That was the case between 2007 and 2011 when ILNumerics was offered by LGPL for free.
Since 2011 ILNumerics has been sold under a proprietary license which starts at 89€ (monthly payment) or 1.300€ (annual payment). Contrary to the annual payment model, the subscription model (with monthly payments) includes updates, upgrades and support.
So, there is still the possibility of a free trial which can be used to evaluate the libraries for your own purposes.
Project idea and data basis
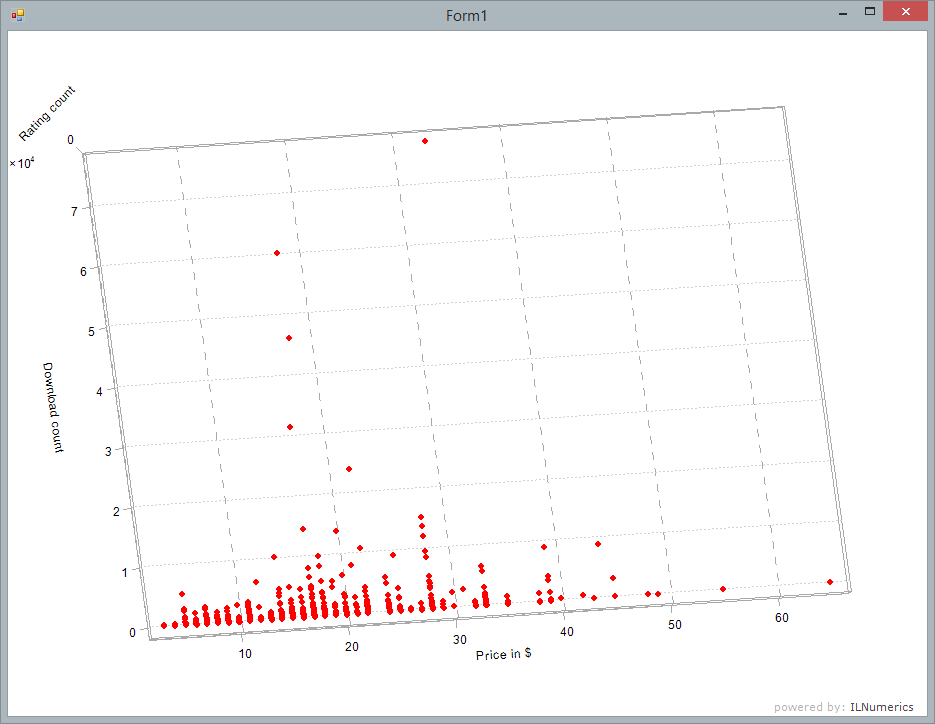
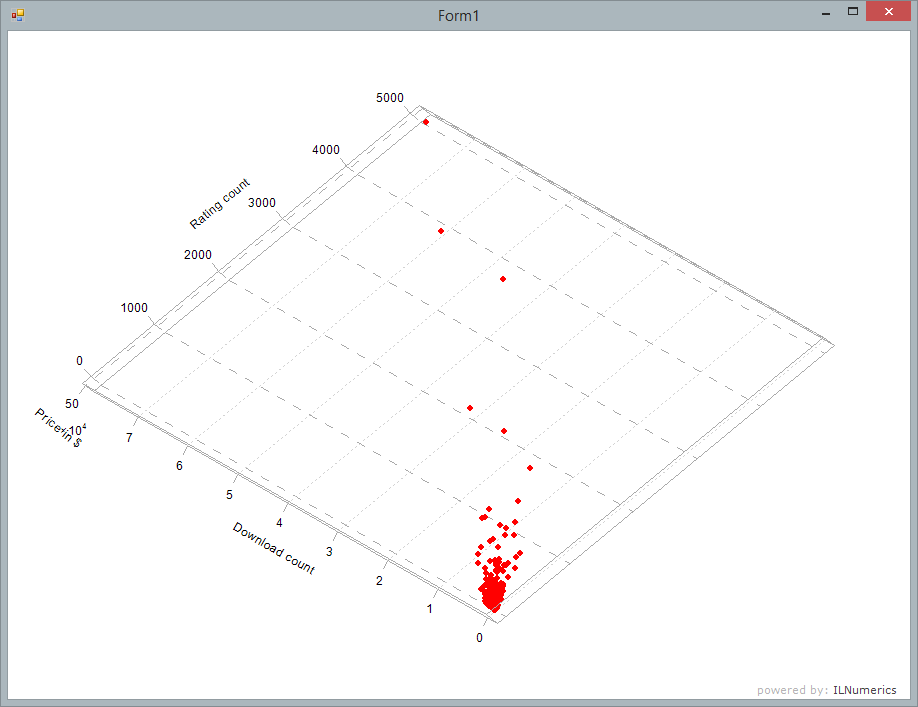
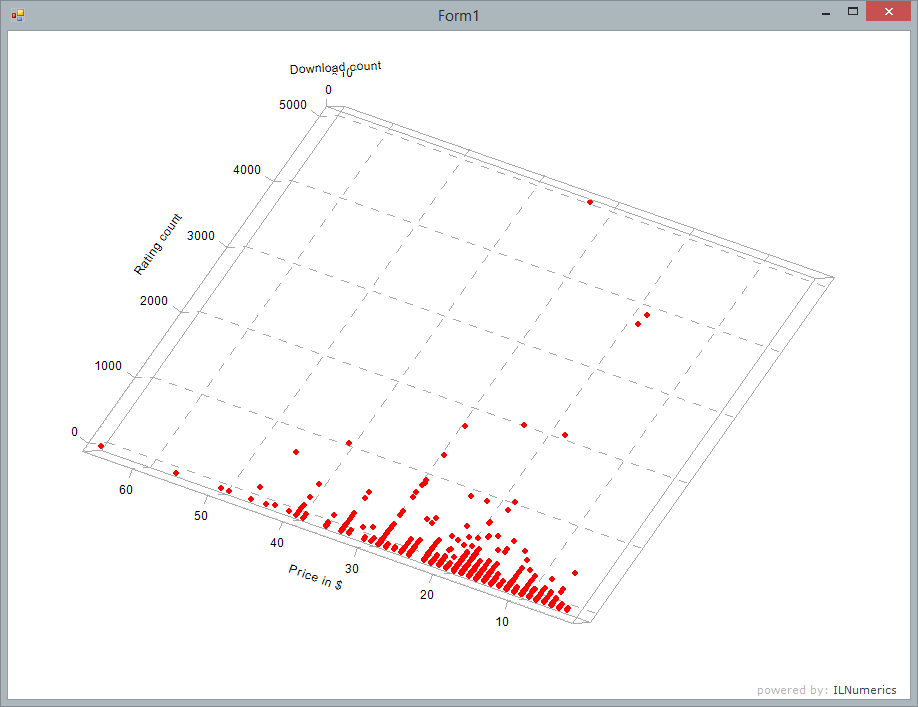
Let’s start with the practice project which we want to implement. The aim is to plot several thousand points into a 3D system. The three coordinates represent information about download numbers, rating and costs of every WordPress plugin on CodeCanyon.
If you want to reconstruct the problem with updated daily data, you may use my small Python crawler that I have written only for the purpose of obtaining these data.
The problem should be clear now and the data should be obtained by the crawler. Let’s move on to the implementation in C#.
Creating a 3D diagram in C#
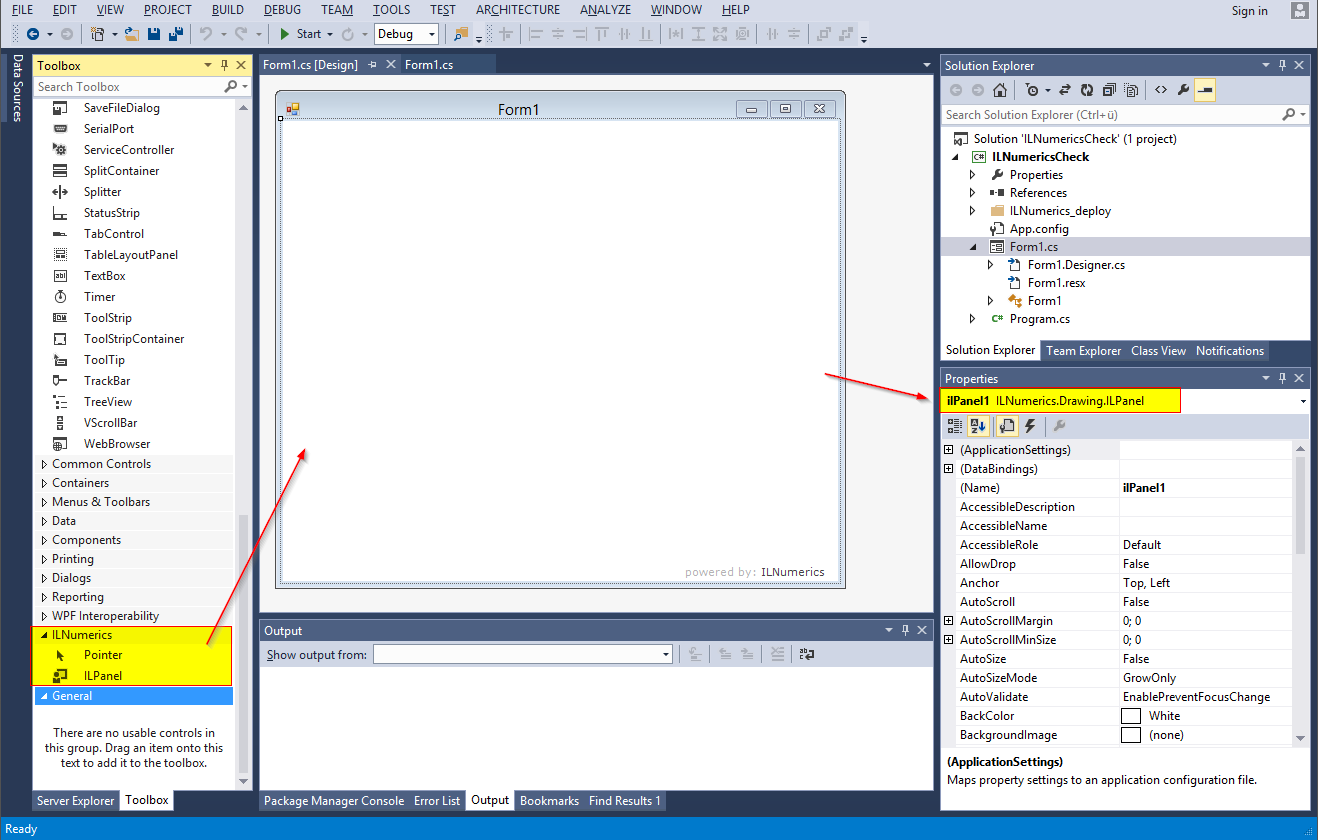 First, we need a new project in Visual Studio – for the sake of simplicity a WinForms Project is sufficient. Now, we go to the form designer and pull the component ILPanel from the toolbox to the form. (The component should be located in the “ILNumerics”-tab in the toolbox after the installation of ILNumerics. If this is not the case, you may right-click in the toolbox, then choose “Add controls” to search for ILNumerics controls and finally add it.)
The code is quite clear, so you may take the function principle of the code direct from the comments in the source code.
//When form loads...
private void Form1_Load(object sender, EventArgs e)
{
	//Open a filestream and read the data points into an comma-seperated string
	StreamReader sr = new StreamReader(Application.StartupPath + "\\stats_plugins.csv");
	string dataLines = string.Empty;
	while (sr.Peek() != -1)
		dataLines += sr.ReadLine().Replace(";",",") + "\n";
	sr.Close();
	dataLines = dataLines.Trim('\n');

	//Convert the data-string into an ILArray
	ILArray<int> AN = ILMath.csvread<int>(dataLines);

	//Create a new scene, which is the base for our graph
	var scene = new ILScene();
	using (ILScope.Enter())
	{
		//Convert all data points to float
		ILArray<float> A = ILMath.tosingle(AN);

		//Add a plot to the scene and configure it
		scene.Add(new ILPlotCube
		{
			//Render in 3D
			TwoDMode = false,

			//Add 3 axes
			Axes =
			{

				XAxis =
				{
					Label = { Text = "Price in $" },
					GridMajor =
					{
						DashStyle = DashStyle.Dashed,
						Color = Color.DarkGray,
						Width = 1
					}
				},
				YAxis =
				{
					Label = { Text = "Rating count" },
					GridMajor =
					{
						DashStyle = DashStyle.Dashed,
						Color = Color.DarkGray,
						Width = 1
					}
				},
				ZAxis =
				{
					Label = { Text = "Download count" }
				}
			},
			//Add the data points
			Children = {
				new ILPoints {
					Positions = A
				},
			},
			//Set start rotation for 3D rendered graph
			Rotation = Matrix4.Rotation(new Vector3(1, 1, 1), 0.5f)
		});
	}

	//Add the scene to the ILPanel
	ilPanel1.Scene = scene;
}
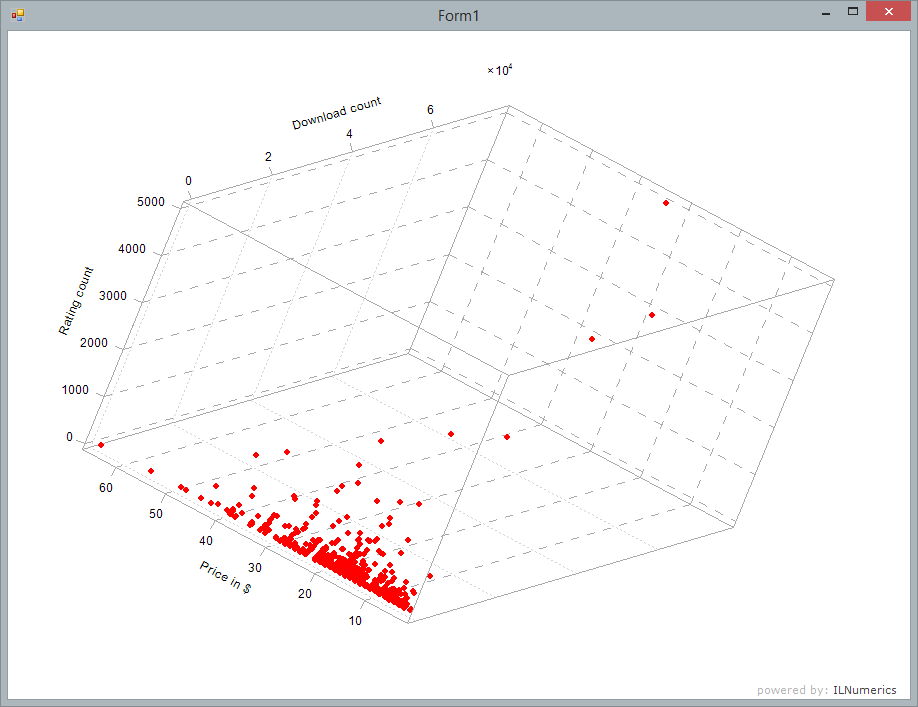
This code will suffice to obtain the result which you see next to this text. By using the ILPanel, you not only receive a decent 3D-plot but you can also rotate, zoom and move it.
By the way, the ILPanel is only one possibility to illustrate a scene. So, it is also possible to create a SVG from the scene which gives you the possibility to show the illustration in web projects. For further information you may read Scott Hanselman’s article on his blog.
Conclusion
The results shown at the end of this paragraph are quiet respectable. Even complex graphs can be plotted without much effort. Though I have to admit that ILNumerics can carry out many more tasks but this exceeds by far my mathematical capacities.
However, the price is high. I definitely don’t have 89€ left every month. Nevertheless compared to the offered perfomance the price seems to be fair and if you get a high volume order, it shouldn’t be an obstacle at all.
Finally, here are three links that may help you in the beginning and with any problems.


The code is simple and understandable. However,
at the last part of adding the data points and rotating there is something not clear.
When I run my code (a csv file with X,Y, Z coordinates) I am getting the following message “Only matrices of size (3 x n ) can be converted to position buffers”